 Economic Update Quarterly
Lawry Knopp, VP-Funding & Hedging
Market Summary
The Federal Reserve remains the primary driver of interest rates as central bankers seek to slow the rate of inflation by tightening monetary policy rates and shrinking its investment holdings through quantitative tightening. Economic data are signaling continued resilience in the labor market and persistent inflation, which will likely provide support for more rate hikes by the Fed. Look for the Federal Open Market Committee to keep the federal funds rate higher for longer as policymakers will want to see a meaningful and sustained downtrend in prices before considering an ease in policy rates. Market indications suggest we are likely 9-18 months away from the first rate cut.
At the conclusion of the September 20-21 FOMC meeting Federal Reserve officials announced a 75-basis point increase in the main policy rate, matching rate hikes for June and July. The increase raised the federal funds rate target range to 3.00%-3.25%. The Committee indicated it will continue reducing the Fed’s investment holdings of Treasury and agency securities by $95 billion per month.
From the Jackson Hole Economic Symposium policymakers indicated they view the job of controlling inflation the Fed’s responsibility. Federal Reserve Chair Jerome Powell said the FOMC’s “overarching focus” is bringing inflation down to the 2% target rate as stable prices are the “bedrock of our economy.” The Fed’s strategy for achieving this goal includes decisive action in raising policy rates and likely keeping rates higher for longer, despite the risk of recession. Powell’s comments acknowledged restoring price stability will likely “take some time” and could “very likely” lead to some softening in the labor markets resulting in some “pain to households and business.” The benefits of restoring stability include better long-term outcomes for the economy and a more certain environment for formulating policy and ultimately a stronger outcome for employment.
Based on recent inflation and employment data and speeches by Fed officials, the market expects a rate hike of 50-75 basis points at the November 1-2 FOMC meeting and 25-50 basis points at the December FOMC meeting. The federal funds rate could reach 4.50 by year-end, which would equate to 400 basis points in monetary tightening for 2022 with more rate hikes possible in 2023.
The global growth outlook has become less certain as foreign economies struggle with rising inflation. As policymakers increase rates to slow demand the outlook for growth weakens. The eurozone is contending with difficult challenges as extremely high natural gas prices caused by turmoil related to the Russian invasion of Ukraine pushes inflation higher. The European Central Bank has responded by increasing policy rates 125 basis points since July with another 75-basis point rate expected near the end of October. Meanwhile, the economic stress from the potential risk of gas rationing this winter could be significant.
The U.K. is facing similar challenges and uncertainty with the Bank of England recently forced to intervene amid a sharp drop in the pound, as the government considers the biggest tax cuts in decades and implements its program to subsidize energy bills. The fiscal response will likely fuel even tighter monetary policy. The BOE may hike policy rates by 75-100 basis points in early November as it works to slow inflation. The U.K. economy is expected to be in recession by yearend or early next year.
So far, the Bank of Japan has maintained its monetary policy unchanged as it remains committed to yield curve control and targeting a 10-year Japanese Government Bond yield of 0.25%. This has resulted in the weakest Japanese yen to U.S. dollar exchange rate in more than two decades.
Geopolitical turmoil is getting more attention as recent advances by the Ukrainian military on Russian forces. Increased uncertainty related to Russia’s military complex may cause greater unrest in the region as various groups held in check by alliances may see this as an opportunity to take advantage of weakened rivals. The recent death of a 22-year-old woman in the custody of Iran’s morality police have led to protests across dozens of Iranian cities.
Interest Rates Review
| U.S. Treasury Yields |
The two-year U.S. Treasury yield has risen to levels not seen since late-2007. The current yield is at the top of the six-month trading range of 2.30%-4.27%. The current level of the two-year yield indicates the market is anticipating more rate hikes by the Fed. The current spread between the two-year and 10-year Treasury yields is around -50 basis points as the curve has been inverted since July 5. 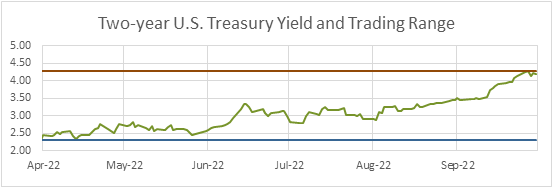 The six-month trading range for the ten-year Treasury yield is 2.33%-3.90%. While inflation remains high, some see rising recession risks. Look for less change in the range unless there are strong indications the Fed will become much more aggressive in its efforts to bring down inflation. If signs of much weaker growth and slower inflation outlook begin to form, longer-term yields could decline, possibly extending and deepening the inverted yield curve. 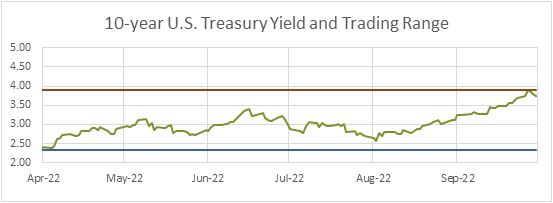 |
Economic Highlights
| Employment |
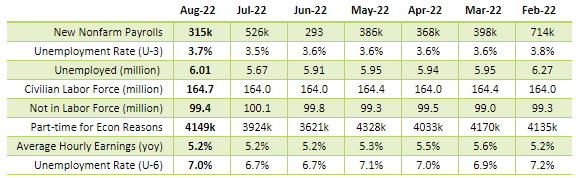
The employment report from the Bureau of Labor Statistics comes from two surveys. The establishment survey reports data related to nonfarm payrolls and earnings. The household survey collects employment and labor force data and is the source for calculating the unemployment rate. Recently, the data has been mixed. Nonfarm Payrolls: Solid job gains in August continued, but at a slower pace compared to July. Despite fears of a slowdown in job growth and a recession, the jobs market remains resilient, keeping upward pressure on wages. Gains were broad-based, led by business services, trade, transportation and utilities, and education and health services. Some companies have signaled cuts in staffing with layoffs coming from technology and housing related businesses. Government jobs rose by 7k while private sector jobs increased 308k. Unemployment Rate: The unemployment rate increased by 0.2 percentage points to 3.7% as a 442k increase in household employment was unable to match growth in the labor force totaling 786k. This resulted in an increase
in the number of unemployed. Meanwhile, the underemployment rate, which includes people who are unable to find a job but are not currently looking and those working part-time but seeking fulltime employment, increased to 7%.
Earnings: Average hourly earnings compared to a year ago remain strong. However, consumer prices are rising faster than wages resulting in continued negative growth in real average hourly earnings. The unemployment rate is a lagging indicator, whereas the Weekly Jobless Claims report can be a leading indicator. Weekly Initial Jobless Claims have moved below 200k with the latest reading at 193k, indicating continued strong demand
for labor. Typically, when jobless claims approach 300k and higher, this usually signals developing weakness for the labor sector. Overall, the report suggests demand for labor remains good, which supports the prospect for more
rate hikes by the Federal Reserve this year and possibly next year.
|
| Economic Growth |
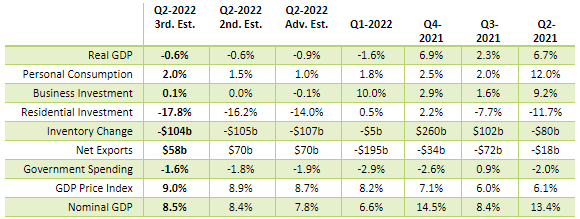
Gross Domestic Product: The “third” estimate of U.S. economic growth by the Bureau of Economic Analysis indicated Q2-2022 real gross domestic product contracted by 0.6%, which was unchanged from the “second” estimate. A deeper look into the revised data showed consumer spending was stronger than initially reported while housing was a greater drag. Furthermore, net exports provided less of an offset to declines in inventory spending.
Looking ahead, we may see limited or slightly negative economic activity for Q3-2022 GDP when the report is released near the end of October. Despite weakness in some sectors of the economy, i.e. housing, consumer spending has held up as demand for labor remains strong. The Atlanta Federal Reserve is forecasting 0.3% growth for Q3. Historically, whenever we’ve seen two consecutive quarters of negative real growth a recession has occurred. However, some market observers do not believe the economy is fully in recession as employment and wage growth remains strong. Others argue we are currently in a very mild recession, which is expected to intensify into year end and the first quarter of 2023. |
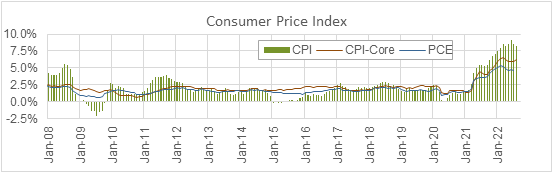
| Consumer Inflation |
Consumer Price Index: August year-over-year consumer inflation was 8.3% compared to 8.5% for July and 9.1% for June. The market was looking for a larger decline to 8.1% as fuel prices for August declined 10.5%. Compared to a year ago, upward pressure from shelter (+6.3%), food (+10.9%) and medical care (5.4%) offset weaker gas prices, which slowed to 26.2% from 45% last month. The year-over-year core CPI rose 6.3%, up from 5.9% last month. On a month-over-month basis, the CPI index rose 0.1%. Fuel prices fell 10.5% which was offset by increases in shelter (+0.7%), food (+0.8%) and medical care (+0.7%). Core inflation, which excludes food and energy increased by 0.6%. Challenges from supply and demand imbalances generated by the COVID-19 outbreak and massive monetary and fiscal policy action remain. The Russian-Ukraine war further exacerbated the supply chain disruptions. Meanwhile, upward pressure from labor costs and housing will likely slow the rate of decent in inflation measures with year-over-year average hourly earnings remaining above 5% and until the lagged impact of high homes prices are realized.
|
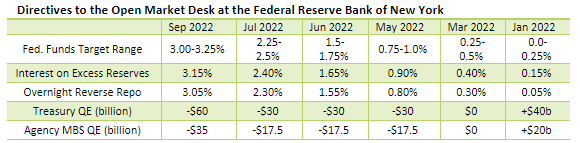
| Monetary Policy |
The table below summarizes recent decisions regarding monetary policy action by the Federal Open Market Committee. The next two FOMC meetings are scheduled for Nov. 1-2 and Dec. 13-14. Futures indicate a potential for 100-125 basis points in rate increases with an additional 25-50 basis points for 2023.
|
View on Interest Rates
The Fed is fully engaged in its efforts to slow the rate of inflation with most other world central banks also in the process of tightening policy measures and rates. The Russian invasion of Ukraine and other geopolitical turmoil are contributing to supply chain disruptions, high inflation and a slower global growth outlook. Look for rates hikes and quantitative tightening to continue until there are strong indications inflation is on a solid downtrend, which may not occur for three to nine months. The Fed will likely tolerate more weakness in the equity markets, but signs of friction in the credit markets or a sharp increase in unemployment could cause the Fed to reassess the pace of rate hikes.
Look for the two-year U.S. Treasury yield trading range to move higher as the market view on monetary policy adjusts to expected action by the Fed. The trading range will likely be 3.9%-4.7% for the next several months, depending on how decisively the Fed responds to inflation, employment and GDP reports. The 10-year yield trading range is expected to follow the 2-year yield higher, although with a lower trading range of 3.40%-4.2%. The yield curve will likely remain inverted until the Fed signals it is considering rate cuts. The trading ranges will be sensitive to economic conditions and shifts in monetary policy.
The above commentary is a summary of select economic conditions prepared for Northwest FCS management. It is being shared as a courtesy. As with any economic analysis, it is based upon assumptions, personal views and experiences of those who provided the source material as well as those who prepared this summary. These assumptions, conclusions and opinions may prove to be incomplete or incorrect. Economic conditions may also change at any time based on unforeseeable events. Northwest FCS assumes no liability for the accuracy or completeness of the summary or of any of the source material upon which it is based. Northwest FCS does not undertake any obligation to update or correct any statement it makes in the above summary. Any person reading this summary is responsible to do appropriate due diligence without reliance on Northwest FCS. No commitment to lend, or provide any financial service, express or implied, is made by posting this information.
Stay up to date
Receive email notifications about Northwest and global and agricultural and economic perspectives, trends, programs, events, webinars and articles.
Subscribe