 Economic Update Quarterly
Lawry Knopp, VP-Funding & Hedging
Market Summary
U.S. monetary policy has been the primary domestic market driver over the past several months. However, with the Russian invasion of Ukraine, investors and traders are wondering what the outcomes will be as sanctions take hold against Russia’s oil and other commodity exports, their currency and other privately held assets. Sanctions have resulted in a sharp increase in oil and gas prices and greatly increased the risk of default by Russia and Russian companies on billions in debt as the ruble has collapsed. Russia’s economy is facing a crippling drop in economic activity with inflation potentially accelerating to 20% or higher. Additional measures by the U.S. and U.K. include suspending imports of oil from Russia while the EU cannot afford to take that step due to their heavy dependance on Russian energy commodities to maintain economic activity. The market continues to be confronted with shifting themes as the war in Ukraine reportedly vacillates between escalation and de-escalation while the global economic growth outlook wavers. Inflation appears to be accelerating with monetary policy seemingly struggling to keep up.
The war in Ukraine likely means extended high inflation, larger energy shortages and supply chain disruptions while the impact of the pandemic lingers. The economic damage from the war is worsening across Europe as high inflation from COVID-19 restrictions were already in play. Look for higher energy prices to slow global economic growth and increase the threat of recession. Furthermore, rising food and energy costs could potentially increase the risk of social unrest in some countries.
Following the March 15-16 Federal Open Market Committee meeting, policymakers announced a 25 basis point increase in the target range for the federal funds rate to 0.25%-0.50%. The Committee indicated more increases in policy rates would be appropriate. This leads the market to believe the Fed is behind the curve and will be more aggressive in increasing rates. Look for several rate hikes over the next 12-18 months with two or three 50 basis point rate hikes possible by summer. The Fed funds target range is expected to end the year at 1.75%-2%, or higher. A 1.75%-2% target range would translate to a commercial bank prime rate of 5%. Furthermore, the Committee said it expects to soon begin reducing its holdings of Treasury and agency debt and agency mortgage-backed securities. This may occur as early as the next meeting, which is scheduled for May 3-4. Until then, maturing securities and principal payments will be reinvested in Treasury and agency securities.
The seven-day moving average for new COVID-19 cases is below 28,000 as reported by the CDC on March 25, down from a peak of just over 804,000 in mid-January. The current level of new cases is similar to last summer. Thankfully, the seven-day moving average for deaths has also greatly decreased, dropping to just over 700 last week from 2,670 in early February.
The initial outbreak of the Omicron variant was labeled BA.1.1 and it overtook the Delta variant within a few weeks. We are now seeing a sub-variant of Omicron known as BA.2 begin to take hold. It accounts for about a third of the new cases. While the number of new cases appears to be minimal, the prevalence of home test kits may be distorting the actual number of cases as the symptoms of Omicron appear to be mild compared to previous variants, which means fewer people are requiring medical assistance.
Economic fundamentals remain in play with inflation proving to be more persistent than earlier thought while employment and economic growth are projected to continue expanding, albeit at a slower pace compared to 2021. Look for continued growth as a resilient U.S. economy remains on relatively firm footing. Nevertheless, ongoing challenges include elevated geopolitical risks, tighter monetary policy, ongoing COVID-19 difficulties, fading fiscal policy and weakening consumer confidence.
Interest Rates Review
| U.S. Treasury Yields |
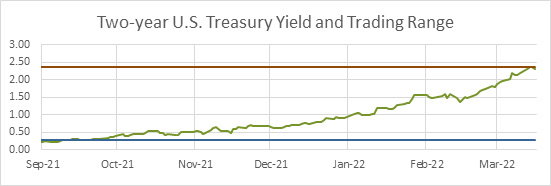
With the Federal Reserve tightening monetary policy, the two-year U.S. Treasury yield has risen to its highest level since mid-2019. The current yield is at the top of the six-month trading range of 0.27%-2.36%. The two-year With the Federal Reserve tightening monetary policy, the two-year U.S. Treasury yield has risen to its highest level since mid-2019. The current yield is at the top of the six-month trading range of 0.27%-2.36%. The two-year yield is up over 200 basis points since last summer, which indicates the market is expecting several more rate hikes by the Fed. If the Fed signals additional rate hikes over the next 12-24 months the yield will likely push higher. The current spread between the two-year and 10-year Treasury yield is less than 5 basis points. In the past, when the two-year yield exceeded the 10-year yield the Treasury curve was said to be inverted, and a recession typically occurred 9-24 months later.yield is up over 200 basis points since last summer, which indicates the market is expecting several more rate hikes by the Fed. If the Fed signals additional rate hikes over the next 12-24 months the yield will likely push higher. The current spread between the two-year and 10-year Treasury yield is less than 5 basis points. In the past, when the two-year yield exceeded the 10-year yield the Treasury curve was said to be inverted, and a recession typically occurred 9-24 months later.  |
|
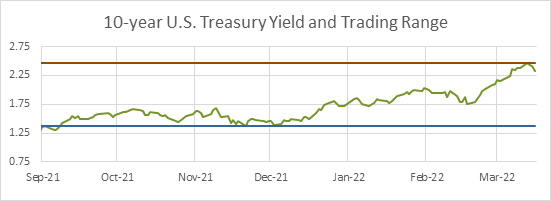
The six-month trading range for the 10-year Treasury yield is 1.38%-2.46%, with expectations it will trend higher as economic reports signal modest economic growth while the Fed tightens policy rates and transitions to quantitative tightening. The inflation and employment outlook are also an indicator of long-term yields. The jump in oil prices is taking a toll on consumers wallets and will likely work to reduce consumer confidence and spending. The top of the 10-year trading range could increase to 2.75% during the second half of the year as it takes time for Fed rate hikes to impact the economy. If signs of a much weaker growth outlook begin to form, longer-term yields could decline, possibly resulting in an inverted yield curve, as discussed above.  |
Economic Highlights
| Employment |
The employment report from the Bureau of Labor Statistics comes from two surveys. The establishment survey reports data related to nonfarm payrolls and earnings. The household survey collects employment and labor force data and is the source for calculating the unemployment rate.
Earnings: Average hourly earnings compared to a year ago remain strong. However, inflation is pushing real average hourly earnings lower. |
| Economic Growth |
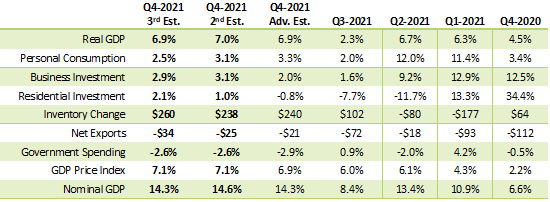
Gross Domestic Product: As more information was released, the final estimate of Q4-2021 GDP growth was revised lower on weaker businesses and residential investment (housing). Inventory growth remained a significant contributor to growth for the quarter while moderate consumer spending (personal consumption) will be watched carefully. The impact of high inflation dropped the U.S. nominal growth rate from 14.3% to a real growth rate of 6.9%. On a year-over-year basis, the economy grew by an inflation adjusted rate of 5.5%. Looking ahead, the strong growth in inventories for Q4-2021 may have pulled forward growth that would have occurred in Q1-2022. The outlook for 2022 is full of uncertainty with the market expecting a 2.5%-3.5% increase in economic activity as the Fed tightens monetary policy and businesses adapt to rising interest rates and inflationary pressure from higher wage costs and geopolitical and pandemic related supply shortages and disruptions. Rising gas prices could hinder consumer confidence and spending in 2022. Fiscal stimulus efforts may impact growth provided Congress is able to agree on a social and climate spending bill.
|
| Consumer Inflation |
Consumer Price Index: CPI continued to accelerate in February with overall inflation coming in at 7.9% (from 7.5% last month) while core inflation rose to 6.2% (from 6% last month), levels not seen in over 40 years. February Total CPI rose 0.8% month over month as motor fuel costs rose by 6.7% and lodging away from home increased 2.2%. Food prices rose 1%. Core CPI, which excludes food and energy, rose 0.5% on strong gains in airline fares (+5.2%) and rent of primary residence (+0.6%).
With West Texas Intermediate crude oil trading in a range of $90-$124 per barrel since mid-February, look for continued upward pressure on headline inflation. Overall, core inflation pressures remain significant due to persistent supply chain problems and higher housing prices and wage costs, which are now being further complicated by energy market turmoil from the Russian invasion of Ukraine. We may not see year-over-year inflation drop below 4% until 2023, which was previously expected to occur around mid-year. |
| Monetary Policy |
Following the March 15-16 Federal Open Market Committee meeting, policymakers announced a 25 basis point increase in the target range for the federal funds rate to 0.25-0.5%. Based on comments in the post-meeting statement the market expects increases in policy rates this year. Furthermore, the Committee said it expects to soon begin reducing its holdings of Treasury and agency debt and agency mortgage-backed securities. The next FOMC meeting is May 3-4.
The Open Market Desk at the Federal Reserve Bank of New York is currently operating under a directive to roll over at auction all principal payments from Fed holdings of Treasury securities and reinvest all principal payments from holdings of agency debt and agency MBS. This action keeps past rounds of QE in place. |
View on Interest Rates
The Fed is applying the monetary policy brakes as inflation is a significant concern while escalating sanctions on Russia complicate the inflation and global growth outlook. Look for the Fed to implement several rate hikes throughout the year as policymakers look to slow the economy and inflation. We may not see the pace of consumer inflation begin to slow for six-12 months as negotiators work for a cease-fire between Russia and Ukraine and provided the pandemic remains under control. Even after this occurs, it will likely take many months to begin to repair the damage from the war. Easing restrictions gave the market hope inflation would ease later this year, but the Russia-Ukraine war compounded and extended the disruptions. Consumers and businesses will continue to adapt to shortages, supply chain disruptions and higher energy prices.
Look for the two-year U.S. Treasury yield trading range to be 2%-2.75% range for the next several months depending on how decisively the Fed responds to inflation, employment and GDP reports. The 10-year yield trading range is expected to also be 2%-2.75% for the next two to three quarters as the curve remains relatively flat. If the equity markets were to experience a sell off, flight-to-safety trading could push U.S. Treasury yields lower and the dollar higher. Signs of an overheating economy or inability of the Fed to control inflation would likely send Treasury yields higher. Ongoing geopolitical development will also sway market rates and prices.
Impact to Northwest FCS
Northwest FCS has been able to meet customer needs through the challenges of the COVID-19 pandemic and expects to continue doing so as people deal with the dynamics of the virus. The association remains watchful for potential threats that may arise.
Stay up to date
Receive email notifications about Northwest and global and agricultural and economic perspectives, trends, programs, events, webinars and articles.
Subscribe


